

Stock Market Crash: Sensex and Nifty Fall Sharply, Nifty Slips Below 23,000. Top Reasons Behind the Fall

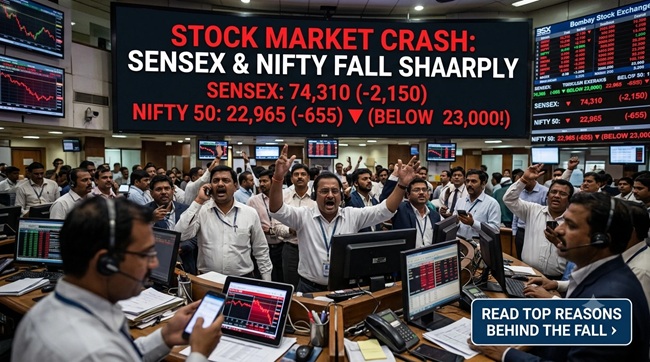
Indian stock markets extended their sell-off for a second straight session this week, with the Nifty 50 trading below the 23,000 mark and touching a six-month low of around 22,569, its weakest level since April 2026. The Sensex fell over 1,000 points in the previous session alone, wiping out roughly ₹7.5 lakh crore in market capitalisation, and both benchmarks have now posted seven consecutive weekly declines. With the Nifty down close to 14% year-to-date in 2026, the index is on track for its worst annual performance in 15 years.
This guide breaks down the actual reasons behind the fall, what technical analysts are watching on the downside, and how to separate near-term market noise from the longer-term picture.
Quick Answer
The Sensex and Nifty have fallen sharply over the past several sessions, with the Nifty slipping below 23,000 to a six-month low near 22,569. The main reasons cited by analysts are surging crude oil prices, which crossed $100 to $107 a barrel amid the ongoing West Asia conflict, sustained foreign institutional investor (FII) selling that has crossed ₹2 lakh crore for the year, elevated global bond yields, a weaker rupee, and broader geopolitical uncertainty. On the technical charts, analysts have flagged near-term support for the Nifty around 22,650 to 22,700, with a break below that level potentially extending the fall toward 22,500 and, in a more extended downside scenario floated by some technical strategists, toward the 21,800 region. There is no single widely confirmed analyst consensus specifically targeting 21,000, so treat any single number circulating online with caution and check the source directly.
About This Guide
This guide was compiled by the FinanceChecks.com editorial team using live market reporting, exchange data and commentary from SEBI-registered technical analysts and brokerages, to give an accurate, same-day summary of what is driving the current market fall. Market predictions, especially specific index targets, vary significantly between analysts and change quickly as new data comes in, so we have clearly separated confirmed facts (index levels, FII selling figures) from technical projections (support and resistance levels), which are opinions, not certainties. We do not accept payment from any brokerage or analyst to influence how their views are covered.
What Has Actually Happened
The Nifty 50 has now traded below the psychologically important 23,000 level for multiple sessions, with an intraday low around 22,569, a level last seen in April 2026. The Sensex fell more than 1,000 points in a single session this week, and the broader decline has erased roughly ₹7.5 lakh crore in investor wealth. Market volatility has spiked alongside the fall, with the NSE’s volatility index (VIX) surging over 5% in a single session, a sign of heightened investor anxiety rather than an orderly decline. Both benchmarks have now recorded seven straight weekly losses, and with a roughly 14% year-to-date decline, the Nifty is on pace for its steepest annual fall since 2011, when FIIs pulled out heavily amid the European debt crisis.
Top Reasons Behind the Fall
1. Surging crude oil prices. Crude oil has been trading above $100, at times crossing $107 a barrel, driven largely by the ongoing conflict in West Asia and disruption to a key regional shipping route. India imports more than 80% of its crude oil needs, so a sustained rise in oil prices directly raises the country’s import bill, pressures the rupee, and threatens to push domestic inflation higher, all of which weigh on investor sentiment toward equities.
2. Sustained foreign institutional investor (FII) selling. FIIs have been net sellers for several consecutive sessions, offloading equities worth thousands of crores in a single day and more than ₹2 lakh crore in the Indian market so far this year. A meaningful driver behind this is relative returns: with bond yields and equity returns higher in some global markets, FIIs have been reallocating capital away from India toward what they see as more attractive opportunities elsewhere.
3. Elevated global bond yields. Higher bond yields, particularly in the US, make fixed-income investments more attractive relative to equities and increase the cost of capital globally. This tends to pull foreign capital away from emerging markets like India and adds pressure on richly valued stocks in particular.
4. A weaker rupee. The rupee has come under pressure alongside rising oil prices and FII outflows, since a weaker currency directly reflects the outflow of foreign capital and raises the cost of imports, including oil, creating a feedback loop that adds to inflation concerns.
5. Broader geopolitical uncertainty. The ongoing West Asia conflict is not just an oil-price story, it has also raised general risk aversion among global investors, who tend to reduce exposure to riskier assets, including emerging market equities, during periods of heightened geopolitical tension.
6. Weekly derivative expiry and technical factors. Some of the sharper single-session moves have coincided with the weekly expiry of Nifty futures and options contracts, a recurring technical factor that can amplify volatility independent of the underlying fundamental reasons for the broader decline.
What Analysts Are Watching on the Charts
Technical analysts look at support and resistance levels to gauge where a decline might slow down or accelerate. It is worth being clear that these are analytical opinions based on chart patterns and historical price behaviour, not guarantees of where the market will actually go.
| Analyst/Source | Immediate Support | Downside Risk If Support Breaks |
|---|---|---|
| Rupak De, LKP Securities | 22,650–22,700 | Further correction possible in the short term |
| Anand James, Geojit Investments | Around 22,600 | Could accelerate toward the 21,800 region |
| Ponmudi R, Enrich Money | 22,700 | Next support seen around 22,500 |
On September 15, 2026, the Nifty’s Relative Strength Index (RSI), a momentum indicator, fell to around 22.23, a level generally considered deeply oversold, which some analysts read as a sign that a sharp bounce could occur even within a broader downtrend. Different analysts hold different views even at the same moment, which is itself a reminder that no single prediction should be treated as certain.
Is a Fall to 21,000 Actually Being Predicted?
Specific downside targets circulating in headlines and social media should be checked carefully against their original source. Based on currently available analyst commentary, the more commonly cited near-term support and downside levels sit in the 22,500 to 22,700 range, with at least one strategist flagging an extended downside scenario around 21,800 if key supports break. If you see a widely circulated “21,000” figure, verify which analyst or brokerage it is attributed to, when it was published, and whether it is a short-term technical projection or a longer-term view, since headlines sometimes round or simplify technical levels in ways that create false precision.
How This Fall Compares Historically
With a roughly 14% year-to-date decline, 2026 is shaping up to be one of the weaker years for Indian equities in recent memory. For context, the Nifty fell 25% in 2011 amid heavy FII outflows during the European debt crisis, and posted a more modest 4% decline in 2015. Corrections of this scale are uncommon but not unprecedented, and markets have historically recovered from similar episodes over subsequent quarters, though the timing and shape of any recovery cannot be predicted with confidence.
What This Means for Different Kinds of Investors
If you are running SIPs toward a long-term goal, a correction like this is generally not a reason to stop investing, since falling prices mean your fixed monthly contribution buys more units, a dynamic covered in more detail in our guide on managing SIPs during market downturns. If you are close to needing money for a short-term goal, this is a reminder that such money should generally not have been sitting in equity in the first place, and it is worth reviewing your asset allocation once the immediate volatility settles rather than making a rushed decision during a sharp move. If you are considering buying individual stocks because prices look cheaper, remember that a falling price alone does not make a stock a good investment, and the same fundamental research discipline applies in a falling market as in a rising one.
Common Mistakes Investors Make During a Sharp Fall
A frequent mistake is redeeming long-term mutual fund holdings out of fear during a correction, which converts a temporary paper loss into a locked-in one. Another is treating a single analyst’s downside target as a market-wide consensus, when different analysts often hold meaningfully different views even in the same week. People also tend to check their portfolios multiple times a day during a volatile stretch, which tends to amplify anxiety without adding useful information, since intraday moves are largely noise relative to a long-term investment horizon. Finally, some investors try to time an exact bottom before re-entering, which is extremely difficult to do consistently and often results in missing the initial part of any recovery.
My Take
The reasons behind this fall are largely external and macro-driven, oil prices, foreign capital flows and global bond yields, rather than a story about Indian corporate earnings or the domestic economy deteriorating on its own. That distinction matters, because it means the eventual stabilisation of markets is more likely to be driven by how the West Asia situation and global rate expectations evolve than by anything happening within India specifically.
The specific downside targets making the rounds are worth treating as informed opinions, not forecasts to plan your finances around. What is more useful than trying to guess the exact bottom is checking whether your own asset allocation already reflects your actual time horizon and risk tolerance. If it does, a correction like this is uncomfortable but manageable. If it does not, this is a reasonable prompt to fix that, once the immediate volatility settles rather than in the middle of a sharp move.
Frequently Asked Questions
1. Why did the Sensex and Nifty crash today? The fall is being driven mainly by surging crude oil prices amid the West Asia conflict, sustained foreign institutional investor selling, elevated global bond yields, a weaker rupee, and broader geopolitical uncertainty.
2. What level has the Nifty fallen to? The Nifty has traded below 23,000, touching a six-month low near 22,569, its weakest level since April 2026.
3. How much has the market fallen in 2026 so far? The Nifty is down close to 14% year-to-date as of late September 2026, putting it on track for its worst annual performance in 15 years.
4. Are analysts really predicting Nifty will fall to 21,000? Currently cited analyst levels focus more on the 22,500 to 22,700 support zone, with one strategist flagging an extended downside scenario around 21,800 if key supports break. Verify any specific “21,000” figure against its original source before treating it as a consensus view.
5. Why do rising oil prices hurt Indian stock markets? India imports more than 80% of its crude oil needs, so higher oil prices raise the import bill, pressure the rupee, and increase inflation risk, all of which weigh on investor sentiment.
6. How much have foreign investors sold this year? FIIs have sold Indian equities worth more than ₹2 lakh crore so far in 2026, with continued net selling in recent sessions.
7. Should I stop my SIP because of this market fall? For long-term goals with a stable income, continuing a SIP through a correction is generally sensible, since it allows you to buy more units at lower prices. See our detailed guide on managing SIPs during market downturns for a fuller breakdown.
8. What is causing the volatility spike alongside the fall? The NSE’s volatility index (VIX) has surged over 5% in recent sessions, reflecting heightened investor anxiety and the uncertainty around how long the current geopolitical and oil-price pressures will last.
9. Has the Nifty fallen this much before? Yes, though not often. The Nifty fell 25% in 2011 amid FII outflows during the European debt crisis and 4% in 2015, making the current roughly 14% year-to-date decline one of the more significant corrections in the past 15 years.
10. What should I do with my investments during this correction? Review whether your asset allocation matches your actual time horizon and risk tolerance, avoid panic-selling long-term holdings, and be cautious of chasing any single analyst’s specific downside prediction as a basis for major financial decisions.
Disclaimer
This article is for general informational purposes only and does not constitute investment advice or a recommendation to buy, sell or hold any security. Market levels, analyst commentary and technical projections cited reflect information available at the time of writing and can change rapidly; technical support and resistance levels are analytical opinions, not guarantees. Readers should conduct their own research or consult a SEBI registered investment adviser before making investment decisions. FinanceChecks.com is not a SEBI registered investment adviser.

Shuchi founded Finance Checks after spending 16+ years working in corporate, managing operations and distribution. She managed her own finances, learned and read regularly and helped people make sense of their savings, loans, insurance, and investments.
She started this site to offer the kind of clear, honest financial guidance she wished was more available when she was learning to manage her own money. Every article is researched personally, checked against official sources such as the Reserve Bank of India, SEBI, or the Income Tax Department, and revisited whenever regulations or figures change. She is upfront about how the site earns money through ads and select affiliate partnerships, and she does not let either influence what she actually recommends to readers.