
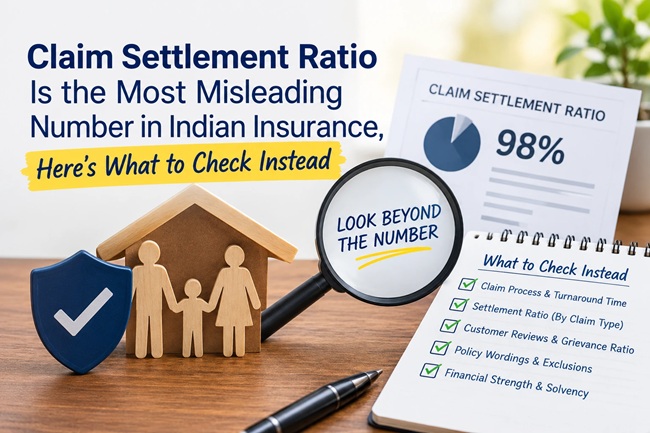
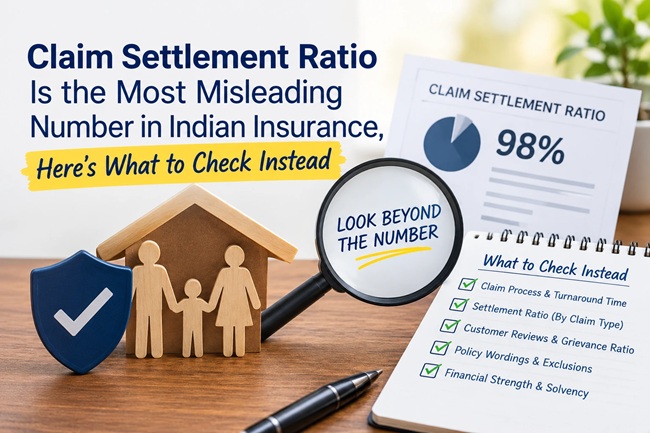
Claim Settlement Ratio Is the Most Misleading Number in Indian Insurance, Here’s What to Check Instead

Every insurance comparison website, every agent’s pitch deck, every advertisement for a term plan leads with the same number: claim settlement ratio, usually somewhere north of 98 percent, printed in bold like it settles the entire decision. It sounds simple. It sounds reassuring. And it’s telling you far less than you think.
Here’s a scenario worth sitting with. An insurer settles 99 small claims worth ₹50,000 each and rejects one claim worth ₹5 crore. Its claim settlement ratio for that year is still 99 percent. Nothing about that headline number tells you the one claim it refused to pay was, in rupee terms, larger than all the others put together.
Quick answer
Claim settlement ratio, or CSR, counts claims by number, not by value, which means an insurer that pays thousands of small claims while rejecting a handful of large, high-value ones can still post a near-perfect ratio. It’s also a company-wide, blended average across every policy type the insurer sells, not a figure specific to the exact plan you’re buying, and a single year’s number can be skewed by unusually low claim volume or one good or bad year. Rather than relying on CSR alone, IRDAI’s own published data lets you check the same thing measured by claim amount rather than claim count, commonly called the Amount or Benefit Settlement Ratio, which tells you whether an insurer pays out on the rupees, not just the paperwork. Alongside that, it’s worth checking the Incurred Claims Ratio for health insurers, the insurer’s solvency ratio, its complaint volume on IRDAI’s Bima Bharosa portal, and multiple years of data rather than a single year’s snapshot. None of these numbers alone tells the full story, but together they give a far more honest picture than a single headline percentage ever can.
About this guide
This guide is based on IRDAI’s published methodology for claim settlement and claims data, including its Handbook on Indian Insurance Statistics and Annual Report, along with general regulatory requirements for insurer solvency, current as of September 2026. FinanceChecks.com is not an insurer, agent, or financial advisor, and this article does not constitute investment or insurance advice. Specific company rankings and exact ratio figures change with every IRDAI release, so always check the regulator’s latest published data directly before making a purchase decision.
What claim settlement ratio actually measures
CSR is calculated as the number of claims settled in a financial year divided by the total number of claims received, including claims carried over from previous years still pending resolution. If an insurer received 10,000 claims and disposed of 9,650 of them, whether by paying or by formally rejecting with a stated reason, its CSR sits at 96.5 percent.
That second part is worth sitting with. In IRDAI’s technical usage, a “settled” claim generally means a claim that has been resolved, decided one way or the other, not necessarily a claim that was paid. Some industry analyses specifically flag that the number most people read as “percentage of claims paid” can, depending on how it’s reported, include claims that were resolved through a valid rejection rather than a payout. This is a nuance worth being aware of, since the everyday assumption that a high CSR means “almost everyone who claims here gets paid” isn’t quite what the number is built to confirm.
The problem with counting claims instead of counting rupees
This is the core issue, and it’s the one every serious analysis of CSR eventually lands on. Treating a ₹50,000 claim and a ₹5 crore claim as identical, one claim, one vote, means an insurer’s CSR can look excellent even if it disproportionately rejects its largest, most financially significant claims. For a young earner buying a ₹1 crore term cover, or a self-employed professional insuring against a genuinely large liability, this is precisely the scenario that matters most, and it’s exactly the scenario a pure claim-count ratio is least equipped to reveal.
IRDAI’s own published statistics address this gap directly, publishing claims data not just by the number of claims settled but also by the rupee value of benefits paid against the rupee value claimed, sometimes referred to as an Amount Settlement Ratio or Benefit Settlement Ratio. When this value-based figure sits meaningfully lower than the standard, claim-count CSR for the same insurer, that gap itself is worth treating as a signal, since it suggests the insurer may be settling a high volume of smaller claims quickly while showing more resistance on larger ones.
Sample size changes what a ratio actually means
A 99 percent CSR built on a few hundred claims and a 97 percent CSR built on several hundred thousand claims are not equally reliable pieces of information, even though the second number looks worse on paper. A large insurer processing a substantial claim volume every year has far less room for a single unusual case to swing its ratio, while a smaller insurer handling a modest number of claims can post a headline-grabbing ratio that’s really just a reflection of a small, less statistically meaningful sample. Before treating any single insurer’s CSR as decisive, it’s worth checking the actual number of claims that ratio was calculated from, both figures are published together in IRDAI’s data, not just the isolated percentage.
Life insurance and health insurance ratios aren’t the same kind of number
This is a distinction that gets flattened in most comparison content, but it matters. A life insurance claim is a binary event tied to a fixed sum assured, either the insured person has died and the policy pays the agreed amount, or it doesn’t. Because of that structural simplicity, life insurer CSRs across the industry tend to cluster tightly near the top, often all sitting somewhere above 95 to 99 percent, which means the ratio does relatively little to actually differentiate between insurers at the margin.
Health insurance works differently. A single health claim can involve itemised hospital bills, multiple treatment codes, sub-limits, room rent caps, and waiting period clauses, any one of which can result in a partial payout, a deduction, or a rejection on a specific portion of the bill rather than a simple yes or no. Because of this added complexity, health insurer ratios tend to sit lower and vary more meaningfully between companies, which paradoxically makes the ratio a more genuinely useful differentiator for health insurance than it typically is for life insurance, where nearly everyone posts an impressively high number.
You May Also Like To Read About:
- Nominee vs Will: Who Has the Legal Right to Your Money and Property in India?
- What Happens to Insurance if Both the Insured Person and Nominee Die in the Same Accident?
- Insurance Scams in India Explained: Real Cases, How They Work, and How to Verify a Genuine Policy
- Family Floater vs Individual Health Insurance: Which Actually Saves You More
- Health Insurance Claim Rejected? Here’s What to Do Next
- Term Insurance for Smokers: Why Your Premium Is So Much Higher, and What You Can Actually Do About It
- Turning 35? Here Is Why Life Insurance Just Became Non Negotiable For You
The other metrics worth putting next to CSR
Incurred Claims Ratio (ICR). This measures how much an insurer pays out in claims relative to the premium it collects. A ratio meaningfully above 100 percent means the insurer is paying out more than it’s taking in on that line of business, which is good news for policyholders in the short term but can be a sign of financial strain if sustained over multiple years. A very low ratio, on the other hand, particularly one held consistently over several years, can suggest an insurer pricing conservatively or trending toward stricter claim scrutiny. Neither extreme is automatically good or bad, but it’s a useful check against an insurer that only shows you its settlement ratio.
Solvency ratio. This measures whether an insurer holds enough capital to meet its future claim obligations. Indian insurers are required to maintain a minimum solvency margin under IRDAI’s regulations, and a ratio trending toward or below that regulatory floor is a legitimate red flag about an insurer’s long-term financial stability, regardless of how impressive its claim settlement ratio looks in any single year.
Complaint and grievance data. IRDAI publishes complaint volumes per policies sold for every insurer, and maintains the Bima Bharosa grievance portal at policyholder.gov.in specifically for policyholders to escalate unresolved disputes. A pattern of rising complaints, even alongside a strong headline CSR, is worth taking seriously, since it often reflects exactly the kind of friction, delayed responses, disputed partial payouts, documentation disputes, that a simple settled-versus-rejected count doesn’t capture.
Multiple years of data, not one. A single year’s CSR can be unusually high or low simply due to claim volume that year, a temporary change in underwriting practice, or one large disputed case. Checking three to four years of consistent data for the same insurer gives a far more reliable picture than treating any one year’s number as definitive.
Where to actually find this data
All of this is publicly available directly from the regulator, not locked behind any comparison website’s proprietary analysis. IRDAI publishes its Handbook on Indian Insurance Statistics and its Annual Report on irdai.gov.in, both of which include claims data broken down by number of claims and by benefit amount, across multiple years, for every major insurer operating in India. It’s worth going to this primary source directly rather than relying solely on a single comparison site’s summary, since third-party sites can vary in how current and how carefully sourced their figures actually are.
My take
What bothers me most about how claim settlement ratio gets used isn’t that the number itself is fabricated, it’s genuinely published by IRDAI and it does measure something real. It’s that the number has been marketed so heavily and so simply that it’s replaced actual due diligence for a lot of buyers, when the honest reality is that no single metric, including this one, was ever built to carry that much weight alone. An insurer with a slightly lower headline CSR but a strong benefit-amount settlement ratio, a healthy solvency position, and a clean complaint record is very likely a better choice than one with a flashier top-line percentage and a wide gap between how it treats small claims versus large ones. The fix isn’t complicated, it’s just slower than reading one bold number off a comparison page, checking two or three figures together instead of one, across a few years instead of one, from the regulator’s own data instead of a single site’s summary.
Frequently asked questions
What is claim settlement ratio and how is it calculated? Claim settlement ratio is the number of claims an insurer settled in a financial year divided by the total number of claims it received, including pending claims from previous years, expressed as a percentage.
Why is claim settlement ratio considered misleading? Because it counts claims by number rather than by value, treating a small claim and a very large claim as equal. An insurer can post a high CSR while disproportionately rejecting its largest, highest-value claims, since those rejections count the same as any other single claim in the ratio.
What is Amount Settlement Ratio or Benefit Settlement Ratio? It’s a version of the same idea measured in rupees rather than claim count, showing what percentage of the total value claimed was actually paid out. IRDAI publishes this figure alongside the standard, claim-count based CSR for insurers.
Does “settled” always mean the claim was paid? Not necessarily. In some reporting, a settled claim includes claims resolved through a valid rejection, not only claims that were paid, which is a nuance worth understanding since it isn’t always obvious from a simple headline percentage.
Why do life insurance CSRs all look similarly high? Life insurance claims are binary, either a fixed sum is paid out following a death, or it isn’t, which is a structurally simpler event than a health insurance claim. This tends to push life insurer CSRs industry-wide toward a similarly high range, making the ratio less useful as a differentiator between life insurers specifically.
Why do health insurance claim ratios vary more between insurers? Health claims involve itemised bills, sub-limits, and policy-specific clauses that can result in partial payouts or rejections on specific portions of a claim, which creates more genuine variation between insurers than the binary outcome of a life insurance claim.
What is Incurred Claims Ratio and why does it matter? It measures how much an insurer pays out in claims relative to the premium it collects. A ratio well above 100 percent may signal financial strain if sustained over time, while a very low ratio over several years can suggest overly conservative claim practices.
What is a good solvency ratio for an insurer? Indian insurers are required to maintain a minimum solvency margin under IRDAI regulation. A solvency ratio trending toward or below that regulatory floor is a legitimate warning sign about an insurer’s ability to meet future claims, regardless of its claim settlement ratio.
Where can I check an insurer’s complaint history? IRDAI’s Bima Bharosa portal at policyholder.gov.in allows policyholders to check and file grievances, and IRDAI separately publishes complaint volumes per policies sold for each insurer in its annual statistics.
Should I check just one year of claim settlement data before buying a policy? No, it’s better to look at three to four years of data for the same insurer. A single year’s ratio can be skewed by unusually low claim volume or one significant disputed case, while a consistent multi-year trend gives a more reliable picture.
Disclaimer
This article is intended for general informational and educational purposes only and does not constitute insurance or financial advice. FinanceChecks.com is not an insurer, agent, or registered financial advisor. Specific claim settlement ratios, benefit amount ratios, and other figures for individual insurers change with each IRDAI publication and are not reproduced as fixed facts in this article; please refer to IRDAI’s official Handbook on Indian Insurance Statistics and Annual Report at irdai.gov.in for current, insurer-specific data before making a purchase decision.

Shuchi founded Finance Checks after spending 16+ years working in corporate, managing operations and distribution. She managed her own finances, learned and read regularly and helped people make sense of their savings, loans, insurance, and investments.
She started this site to offer the kind of clear, honest financial guidance she wished was more available when she was learning to manage her own money. Every article is researched personally, checked against official sources such as the Reserve Bank of India, SEBI, or the Income Tax Department, and revisited whenever regulations or figures change. She is upfront about how the site earns money through ads and select affiliate partnerships, and she does not let either influence what she actually recommends to readers.