
Titan Company vs Kalyan Jewellers: Stock Returns, Mutual Fund Holdings and Top 5 Schemes in 2026

Titan Company vs Kalyan Jewellers: How Do Mutual Fund Bets Differ?
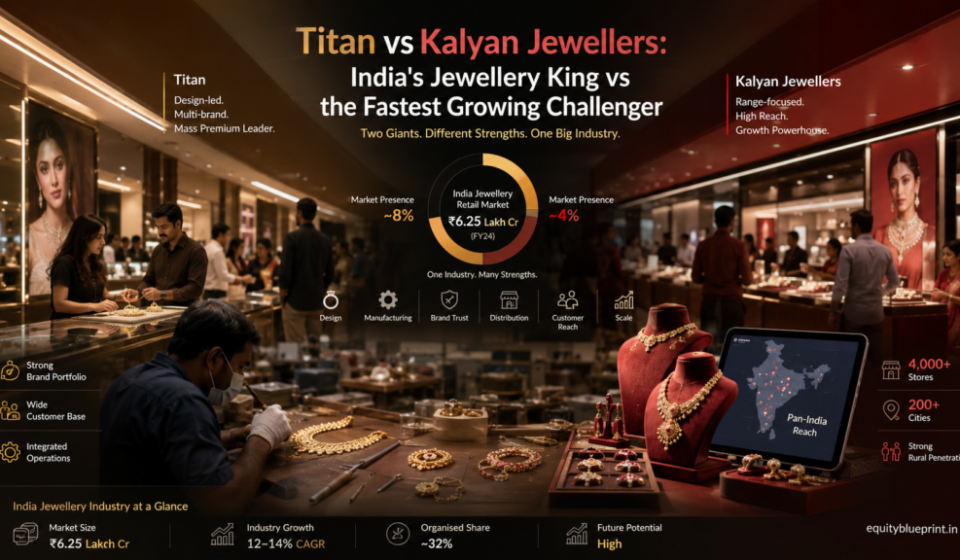
Titan Company and Kalyan Jewellers India are two prominent names in India’s organised jewellery market. Both benefit from consumer spending on gold, diamond jewellery and wedding purchases, but their business models, scale, brand positioning and stock-market characteristics are different.
Over the one-year period highlighted in this comparison, Titan Company delivered a return of 17%, while Kalyan Jewellers India gained 13%. Titan therefore outperformed Kalyan by four percentage points during the period.
However, stock returns tell only part of the story. Mutual fund holdings offer another perspective on how investment portfolios are positioned across the jewellery sector.
Some mutual funds hold Titan because of its representation in consumer-oriented indices and its position in the organised retail market. Others invest in Kalyan Jewellers through actively managed mid-cap, flexi-cap and consumption-oriented strategies.
The important question is not simply which stock delivered higher returns. It is also how much of each fund’s portfolio is allocated to these companies, which schemes have the highest exposure, and what those holdings reveal about different investment approaches.
In this article, FinanceChecks compares Titan Company and Kalyan Jewellers, examines selected mutual fund holdings reported for September 2026, and explains how investors can interpret the data without treating fund ownership as a buy or sell recommendation.
Data note: The 17% and 13% one-year returns are the figures provided in the article brief. Returns depend on the exact measurement date and price-adjustment methodology. Mutual fund holdings below are based on published September 2026 holdings data available in October 2026. Portfolio weights and values can change with market prices and subsequent disclosures.

1. Titan Company vs Kalyan Jewellers: Key Differences
Titan Company Limited is a consumer lifestyle business with a strong presence in jewellery through Tanishq, Mia and other brands. Its broader business portfolio also includes watches, eyewear and other consumer products.
Kalyan Jewellers India Limited focuses primarily on jewellery retailing, operating under the Kalyan Jewellers brand and its Candere business. Its retail expansion and exposure to organised jewellery demand make it an important listed company in the sector.
Although both companies are exposed to jewellery demand, their investment profiles are not identical.
| Comparison | Titan Company | Kalyan Jewellers |
|---|---|---|
| Core positioning | Diversified consumer lifestyle business with a major jewellery segment | Jewellery-focused retail business |
| Major brand | Tanishq, alongside other consumer brands | Kalyan Jewellers and Candere |
| One-year return in the brief | 17% | 13% |
| Return difference | Outperformed Kalyan by 4 percentage points | Trailed Titan by 4 percentage points |
| Mutual fund ownership pattern | Broad ownership across index, consumer-themed and diversified funds | Meaningful ownership across mid-cap, flexi-cap and other actively managed schemes, alongside index and arbitrage holdings |
| Key investment consideration | Growth, brand strength, valuation and execution across business segments | Retail expansion, profitability, valuation and jewellery demand |
Titan’s broader business portfolio can appeal to funds looking for exposure to Indian consumption beyond jewellery alone. Kalyan Jewellers, meanwhile, provides more concentrated exposure to jewellery retailing.
This distinction helps explain why mutual fund portfolios may allocate differently to the two stocks.
2. Titan Company Delivered 17% Returns vs Kalyan Jewellers’ 13%
Based on the one-year returns provided for this comparison, Titan Company gained 17%, compared with 13% for Kalyan Jewellers.
The difference is four percentage points. Put another way, an illustrative investment of ₹1 lakh would become ₹1.17 lakh in Titan and ₹1.13 lakh in Kalyan over the same period, assuming the quoted returns apply to that holding period and excluding taxes, transaction costs and other charges.
This is an illustration of past performance, not a forecast.
Why might the two stocks perform differently?
Brand strength and customer demand: Titan’s established jewellery brands and diversified consumer presence can influence investor expectations around growth and profitability.
Business expansion: Kalyan’s performance can be influenced by new store openings, geographic expansion, same-store sales and its ability to improve operating efficiency as it grows.
Gold prices and jewellery demand: Higher gold prices can affect jewellery affordability, customer buying behaviour, average transaction values and working-capital requirements. The impact is not necessarily the same for every retailer.
Valuation: A company can report strong business growth and still deliver modest stock returns if investors have already priced in substantial future growth. Conversely, a stock can rise sharply when expectations improve.
Market sentiment: Interest rates, broader equity-market movements, foreign investor activity and domestic mutual fund flows can all affect share prices.
Therefore, Titan’s higher one-year return does not automatically mean it is the better investment at today’s price. Nor does Kalyan’s lower return mean the stock is undervalued.
Investors need to assess the valuation, business outlook and risks alongside historical returns.
3. Which Mutual Funds Have the Highest Exposure to Titan Company?
September 2026 mutual fund holding data show that Titan is owned across a broad range of schemes. The reported universe includes index funds, exchange-traded funds, consumer-themed schemes and actively managed equity funds.
One important detail: a scheme with the highest percentage of its portfolio invested in Titan is not necessarily the scheme with the largest rupee investment in Titan. A smaller fund can have a higher allocation percentage but own fewer shares in absolute terms.
The following five schemes are examples of funds reporting relatively high Titan portfolio weights in the available September 2026 data.
| Mutual fund scheme | Reported Titan portfolio weight |
|---|---|
| Groww Nifty Non-Cyclical Consumer Index Fund | 8.23% |
| Baroda BNP Paribas India Consumption Fund | 7.79% |
| UTI India Consumer Fund | 7.43% |
| Tata India Consumer Fund | 6.91% |
| SBI Nifty India Consumption Index Fund | 5.89% |
Source: September 2026 mutual fund holdings data published by IPO Track. These are selected high-exposure schemes from the reported data, not a claim that this is an exhaustive ranking across every scheme in India. Holdings and weights may change. Index and ETF holdings are often driven by index methodology rather than discretionary stock selection.
What do these Titan holdings tell us?
The names in this group reveal a clear theme: several funds holding a relatively high proportion of their portfolios in Titan are linked to consumer spending.
Consumer-focused funds: Schemes such as Baroda BNP Paribas India Consumption Fund, UTI India Consumer Fund and Tata India Consumer Fund invest around consumption-related themes. Titan’s jewellery business and broader consumer portfolio fit within this investment universe.
Index funds: The Groww Nifty Non-Cyclical Consumer Index Fund and SBI Nifty India Consumption Index Fund provide index-linked exposure. Their allocations should not automatically be interpreted as a fund manager making an active bullish call on Titan.
Portfolio concentration: An allocation of around 6%–8% to one stock can materially influence a fund’s performance. If Titan rises or falls, the impact on the fund depends on its weight, the stock’s price movement and the performance of the rest of the portfolio.
For investors, the key takeaway is that Titan’s appeal extends beyond investors who specifically want a jewellery stock. It can also serve as exposure to organised retail and Indian consumption.
4. Which Mutual Funds Have the Highest Exposure to Kalyan Jewellers?
Kalyan Jewellers also features in several mutual fund portfolios, including mid-cap and flexi-cap schemes.
September 2026 holdings data published by IPO Track identify the following funds among those with high reported portfolio weights in Kalyan Jewellers.
| Mutual fund scheme | Reported Kalyan Jewellers portfolio weight |
|---|---|
| Motilal Oswal Flexi Cap Fund | 8.23% |
| Motilal Oswal Midcap Fund | 7.98% |
| Motilal Oswal Consumption Fund | 5.17% |
| Motilal Oswal Special Opportunities Fund | 4.98% |
| Motilal Oswal Active Momentum Fund | 4.70% |
Source: September 2026 holdings data published by IPO Track. Figures reflect the reported portfolio weights for the relevant disclosure period. The table presents selected high-exposure schemes and may not represent a complete ranking of every mutual fund scheme. Holdings change over time.
What stands out in Kalyan Jewellers’ mutual fund ownership?
The selected list shows exposure across several investment approaches within the Motilal Oswal fund range.
Mid-cap investing: Motilal Oswal Midcap Fund offers exposure through a mid-cap investment strategy. Its allocation to Kalyan needs to be viewed alongside the fund’s other holdings and its overall risk profile.
Flexi-cap investing: Motilal Oswal Flexi Cap Fund has flexibility to invest across market capitalisations within its mandate. Its Kalyan holding represents one part of a broader portfolio.
Consumption themes: Motilal Oswal Consumption Fund provides a thematic route to consumer-facing businesses, including companies connected with organised retail.
Special situations and momentum strategies: Special Opportunities and Active Momentum funds follow different investment approaches. Their holdings can reflect a particular portfolio thesis, investment process or changing market signals.
However, the appearance of several schemes from the same fund house does not mean all five funds share the same investment rationale. Different schemes can have different mandates, risk limits, portfolio construction methods and holding periods.
It is also important to distinguish a fund’s portfolio weight from its rupee value invested. A large fund can own a greater amount of Kalyan shares while allocating a smaller percentage of its assets to the stock.
5. Titan vs Kalyan Jewellers: What Do the Mutual Fund Bets Reveal?
The comparison becomes more useful when we look beyond the names of individual schemes.
Titan’s exposure reflects consumer and index-linked positioning
The selected Titan holdings include multiple consumer-oriented schemes and index-linked funds. This suggests that Titan’s role in mutual fund portfolios is connected not only to its jewellery business but also to its wider position in the consumer economy.
Because index funds follow their underlying indices, their ownership should not be treated as equivalent to an active fund manager independently selecting Titan after evaluating its valuation and growth prospects.
Kalyan Jewellers has visible exposure in selected actively managed schemes
The selected Kalyan holdings include mid-cap, flexi-cap, consumption, special-opportunities and momentum funds. These mandates provide different routes through which the stock can enter a mutual fund portfolio.
A high weight in an actively managed scheme may indicate that the stock is an important position within that particular portfolio. It does not, by itself, establish that the fund manager expects the stock to outperform in the future.
The two lists are not directly comparable without context
Comparing 8.23% in one fund with 8.23% in another fund does not establish that the underlying investments are equally attractive.
The funds may differ in:
- Total assets under management.
- Investment mandate and eligible stock universe.
- Number of holdings and concentration limits.
- Risk tolerance and expected holding period.
- Reasons for buying or retaining the stock.
- Portfolio changes since the reporting date.
The same portfolio weight can therefore represent different investment decisions.
6. What Is the Difference Between Highest Exposure and Largest Mutual Fund Holding?
This is one of the most important distinctions for retail investors reading mutual fund ownership data.
Highest exposure by portfolio weight means the stock represents the largest percentage of a particular fund’s total portfolio.
Largest holding by rupee value means the fund owns shares worth the greatest amount of money, regardless of what percentage of its total assets those shares represent.
Consider a simplified example:
| Measure | Fund A | Fund B |
|---|---|---|
| Total fund assets | ₹100 crore | ₹1,000 crore |
| Investment in a stock | ₹8 crore | ₹30 crore |
| Stock as a percentage of assets | 8% | 3% |
Fund A has the higher portfolio exposure at 8%. Fund B, however, has the larger investment in rupee terms at ₹30 crore.
Both measurements are useful, but they answer different questions.
If you want to understand which fund has the greatest conviction in a stock, portfolio weight can provide a clue for actively managed schemes. If you want to understand which fund owns the most shares or has the greatest monetary exposure, the absolute holding value is more relevant.
Even portfolio weight should be interpreted carefully. A high allocation can reflect an investment decision, but it may also result from a stock price rising faster than the rest of the portfolio.
7. How Can Investors Analyse Mutual Fund Ownership of Titan and Kalyan?
Mutual fund ownership data can help investors understand institutional participation. They are not a substitute for evaluating the underlying companies.
Here are six checks worth making before drawing conclusions from these holdings.
1. Check the reporting date
Mutual funds publish portfolio disclosures periodically. A fund’s September holding may have changed by October or may change again in subsequent months.
Always check the date of the portfolio disclosure before using the information to make an investment decision.
2. Compare portfolio weight over several months
A single month’s holding tells you what a fund owned at that point in time. Comparing several months can reveal whether the allocation is increasing, decreasing or broadly stable.
However, changes in weight do not always equal purchases or sales. Share-price movements and changes in the fund’s total assets can also affect portfolio percentages.
3. Separate active funds from index funds
Index funds and ETFs generally hold stocks to track a benchmark. Their holdings may reflect index composition, rebalancing and changes in index weights.
An actively managed fund has more discretion over its stock selection, subject to its mandate and investment process.
This distinction matters when interpreting whether a holding represents an active investment thesis.
4. Look at business fundamentals
For Titan, investors can examine jewellery demand, brand strength, store expansion, margins, competitive positioning and the performance of its non-jewellery businesses.
For Kalyan Jewellers, relevant factors include store expansion, same-store sales, profitability, working capital, debt, cash flow and the execution of its retail strategy.
The latest company filings and earnings disclosures should be used to assess these factors rather than relying solely on stock-price performance.
5. Compare valuation with expected growth
A high-quality company can be an unattractive investment if its stock price already reflects overly optimistic growth expectations.
Investors can examine valuation measures such as price-to-earnings ratios, earnings growth, return on capital and cash-flow generation. These should be compared over consistent periods and interpreted in light of each company’s business model.
A higher valuation does not automatically make a stock a sell, just as a lower valuation does not automatically make it a bargain.
6. Consider the risks of concentrated exposure
When a fund allocates a substantial percentage of its portfolio to one company, the stock’s performance can have a greater effect on the fund’s returns.
Investors should review the fund’s complete portfolio, investment objective, risk profile and suitability for their own financial goals.
Owning a stock through a mutual fund also does not eliminate market risk. The value of the fund can fall when its underlying investments decline.
8. What Are the Main Risks for Titan Company and Kalyan Jewellers?
Both companies operate in a sector influenced by discretionary spending, gold prices and consumer confidence. Their specific business risks, however, differ.
Titan Company: Key risks to watch
Valuation risk: Investors may already be paying a premium for Titan’s brand strength and growth prospects. If future results do not meet expectations, the share price could face pressure.
Jewellery-sector exposure: Although Titan has other businesses, jewellery remains a major part of its operations. Changes in jewellery demand and customer buying patterns can affect growth.
Competition: Titan faces competition from organised jewellery retailers, regional players and other brands competing for consumer spending.
Execution risk: Store expansion, inventory management, margins and performance across business segments can influence future earnings.
Kalyan Jewellers: Key risks to watch
Expansion and execution: New stores create opportunities, but their success depends on location selection, customer demand, operating costs and the ability to achieve profitable growth.
Gold-price movements: Changes in gold prices can affect consumer purchasing decisions, jewellery volumes and working-capital requirements.
Competition: Kalyan operates in a competitive market that includes established jewellery brands, regional retailers and other organised chains.
Profitability and cash flow: Rapid expansion should be assessed alongside margins, working-capital needs, debt and the company’s ability to generate sustainable cash flow.
These risks do not determine which stock will perform better. They identify areas investors should monitor when evaluating future business performance and valuation.
9. Should Investors Prefer Titan Company or Kalyan Jewellers in 2026?
There is no universal answer. The choice depends on the investor’s goals, risk tolerance, valuation assessment and view of the jewellery market.
Titan may appeal to investors seeking exposure to an established consumer brand with a diversified business portfolio and a significant jewellery operation. Its wider business mix is an important distinction from a jewellery-focused retailer.
Kalyan Jewellers may interest investors evaluating organised jewellery retail expansion and the potential growth of its retail network. That opportunity must be assessed alongside execution risks, profitability, valuation and cash generation.
The one-year returns in this comparison favour Titan by four percentage points. But a one-year performance gap is not enough to establish which stock will generate better returns over the next three, five or ten years.
Similarly, the presence of a stock in a mutual fund’s portfolio should not be interpreted as an endorsement for every investor. Fund managers invest according to their mandates, objectives and portfolio constraints, which may differ considerably from those of an individual investor.
Before investing directly in either stock, review the latest financial statements, valuation, business outlook and risk factors. If you prefer mutual funds, assess the fund’s complete portfolio, mandate, costs and suitability rather than choosing a scheme solely because it owns Titan or Kalyan Jewellers.
10. Frequently Asked Questions
Which stock performed better over the one-year period in this comparison: Titan or Kalyan Jewellers?
Titan Company delivered a 17% return, compared with 13% for Kalyan Jewellers, based on the figures provided for this comparison. Titan outperformed by four percentage points. Actual returns depend on the exact start and end dates used.
Which mutual funds have the highest exposure to Titan Company?
Selected high-exposure schemes in the September 2026 data include Groww Nifty Non-Cyclical Consumer Index Fund, Baroda BNP Paribas India Consumption Fund, UTI India Consumer Fund, Tata India Consumer Fund and SBI Nifty India Consumption Index Fund. Their reported Titan portfolio weights ranged from 5.89% to 8.23% in the cited dataset.
Which mutual funds have the highest exposure to Kalyan Jewellers?
Selected high-exposure schemes include Motilal Oswal Flexi Cap Fund, Motilal Oswal Midcap Fund, Motilal Oswal Consumption Fund, Motilal Oswal Special Opportunities Fund and Motilal Oswal Active Momentum Fund. Reported portfolio weights in the September 2026 data ranged from 4.70% to 8.23%.
Does high mutual fund ownership mean a stock is a good investment?
No. Mutual fund ownership shows that a scheme holds a stock, but it does not guarantee future returns. Investors should consider valuation, business fundamentals, portfolio concentration, risk and their own investment objectives.
Is portfolio weight the same as the value of a mutual fund’s holding?
No. Portfolio weight is the percentage of a fund’s assets invested in a stock. Holding value is the monetary value of the shares owned. A smaller fund can have a higher portfolio weight while a larger fund owns more shares in rupee terms.
Do index funds holding Titan or Kalyan indicate a bullish fund manager?
Not necessarily. Index funds generally hold stocks to track their benchmarks. Their ownership can result from index composition rather than a discretionary decision by the fund manager to favour a particular stock.
Can investors use mutual fund holdings to predict stock prices?
Mutual fund holdings can provide useful context on institutional participation and changes in portfolio allocation, but they are not reliable standalone predictors of future prices. Holdings are historical disclosures, and investment decisions should incorporate current financial and valuation information.
Final Takeaway
Titan Company and Kalyan Jewellers offer different ways to participate in India’s organised jewellery market. Titan’s 17% one-year return exceeded Kalyan’s 13% return in the period covered by this comparison, but that historical difference does not determine future performance.
The mutual fund holdings also reveal different portfolio patterns. Selected high-exposure Titan schemes include consumer-themed and index-linked funds, while the Kalyan list features mid-cap, flexi-cap, consumption and other actively managed strategies.
For investors, the most useful approach is to look beyond the stock-return headline. Understand why a stock appears in a fund’s portfolio, distinguish portfolio weight from holding value, examine changes across reporting periods and evaluate the underlying business and valuation.
A mutual fund’s holding can inform your research, but it should never replace your own assessment of risk, valuation and investment goals.
Disclaimer
This article is for educational and informational purposes only and should not be considered investment advice or a recommendation to buy, hold or sell any stock or mutual fund. Equity investments are subject to market risks, including the possible loss of capital. Mutual fund portfolios and stock prices change over time. Verify the latest company disclosures and mutual fund factsheets before making investment decisions. Consider consulting a SEBI-registered investment adviser for advice suited to your circumstances.

Shuchi founded Finance Checks after spending 16+ years working in corporate, managing operations and distribution. She managed her own finances, learned and read regularly and helped people make sense of their savings, loans, insurance, and investments.
She started this site to offer the kind of clear, honest financial guidance she wished was more available when she was learning to manage her own money. Every article is researched personally, checked against official sources such as the Reserve Bank of India, SEBI, or the Income Tax Department, and revisited whenever regulations or figures change. She is upfront about how the site earns money through ads and select affiliate partnerships, and she does not let either influence what she actually recommends to readers.