
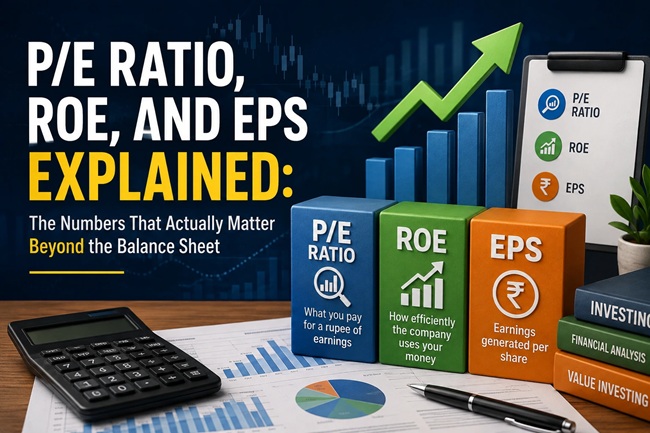
P/E Ratio, ROE, and EPS Explained: The Numbers That Actually Matter Beyond the Balance Sheet

Arjun had gotten reasonably comfortable reading a balance sheet, checking a company’s assets, liabilities, and debt levels before buying a stock. So when a colleague mentioned a stock “looked expensive at this P/E,” he nodded along without actually knowing what that meant, or how to check it himself. He’d learned to tell if a company was financially healthy. He hadn’t yet learned to tell if the stock itself was a good deal at its current price, which turns out to be a completely different question with its own set of numbers.
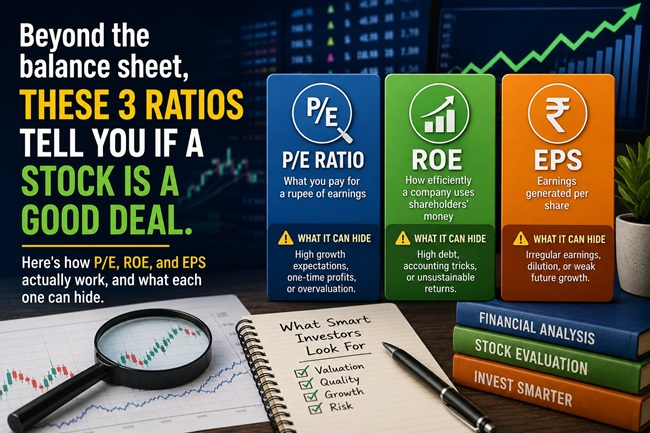
This is exactly where P/E ratio, ROE, and EPS come in. A balance sheet tells you whether a company is built on solid ground. These three ratios tell you whether the stock is actually worth what the market is currently charging for it, and how efficiently the company turns its resources into profit. Here’s what each one actually means, and more importantly, what they miss when you look at them in isolation.
EPS: The Building Block Everything Else Is Based On
Earnings Per Share is the simplest of the three, and it’s the foundation the other two ratios are built on. It’s calculated by taking a company’s total net profit and dividing it by the number of outstanding shares.
EPS = Net Profit / Total Number of Outstanding Shares
If a company earns 500 crore rupees in net profit and has 100 crore shares outstanding, its EPS is 5 rupees. On its own, EPS tells you how much profit is attributable to each individual share you own, but the raw number doesn’t mean much without context, 5 rupees of EPS could be excellent or mediocre depending entirely on the company’s share price and how that EPS has trended over time. A rising EPS over several years generally signals a company that’s growing its profitability, which is exactly why it feeds directly into the next ratio.
P/E Ratio: What You’re Actually Paying for Those Earnings
The Price-to-Earnings ratio takes EPS and connects it to what the market is actually charging for the stock. It’s calculated as:
P/E Ratio = Current Share Price / Earnings Per Share
If a stock trades at 100 rupees and its EPS is 5 rupees, its P/E ratio is 20. This means investors are willing to pay 20 rupees for every 1 rupee of the company’s current annual earnings. A useful way to think about this is as a payback multiple, at a P/E of 20, if the company’s earnings stayed exactly flat, it would take 20 years of profit to theoretically “earn back” the price you paid for the stock.
A higher P/E generally suggests the market expects stronger future growth from that company, while a lower P/E can suggest either an undervalued opportunity or a company the market has genuine concerns about, and figuring out which one you’re looking at requires digging deeper than the ratio alone.
To ground this with a real number, the Nifty 50’s overall P/E ratio stood at around 20.6 as of mid-August 2026, compared to its 10-year historical average of roughly 23.4. This puts the broader Indian market in what’s generally considered a fairly valued to moderately attractive zone based on historical patterns, neither in obvious bargain territory nor stretched into clearly expensive levels. Individual stocks can, and often do, trade well above or below this broader market average depending on their specific growth prospects and sector.
ROE: How Efficiently a Company Uses Your Money
Return on Equity measures how effectively a company generates profit from the money shareholders have invested in it. It’s calculated as:
ROE = Net Profit / Shareholders’ Equity, expressed as a percentage
If a company has 200 crore rupees in shareholders’ equity and generates 40 crore rupees in net profit, its ROE is 20 percent. This tells you that for every 100 rupees of shareholder money the company is working with, it’s generating 20 rupees of profit annually. Generally, a consistently higher ROE, particularly one that holds steady or grows over several years rather than spiking briefly, signals a company that’s genuinely efficient at deploying capital, a quality that matters enormously for long-term compounding.
Here’s the catch worth understanding clearly: ROE can be artificially inflated by high debt. A company that borrows heavily rather than using shareholder equity can show an impressively high ROE purely because the equity base in the denominator is small, not necessarily because the underlying business is exceptionally efficient. This is exactly why ROE should never be checked without also glancing at a company’s debt levels, which is where your existing balance sheet reading skills come back into play alongside these ratios, not instead of them.
How These Three Work Together
Individually, each ratio answers a narrow question. EPS tells you how much profit belongs to each share. P/E tells you how expensive the stock is relative to those earnings. ROE tells you how efficiently the company is generating that profit in the first place. Used together, they start painting a genuinely useful picture.
A stock with rising EPS, a reasonable P/E relative to its sector and growth rate, and a strong, stable ROE, ideally without excessive debt propping that ROE up, is generally a healthier combination than any one of these metrics looking good in isolation. Conversely, a stock with a high P/E but declining EPS is a common warning sign, the market is pricing in growth expectations that the company’s actual recent performance isn’t backing up.
Where Each Ratio Can Genuinely Mislead You
P/E ratios are notoriously unreliable when comparing companies across different sectors. A software company and a steel manufacturer operate with fundamentally different growth expectations, capital requirements, and earnings cycles, so a “high” P/E in one sector might be entirely normal in another. P/E comparisons are far more meaningful within the same sector than across the broader market.
P/E can also be distorted by a temporary earnings spike or a one-off loss. A company that sold a major asset and booked a one-time profit will show an artificially low P/E that has nothing to do with its ongoing, sustainable business performance. This is why looking at EPS trends over several years, not just the most recent quarter, matters more than a single snapshot.
ROE, as covered above, can be inflated by high leverage, and can also look temporarily excellent for a company that’s been buying back its own shares aggressively, since reducing the equity base mechanically boosts the ratio without any actual improvement in underlying business efficiency.
EPS alone doesn’t account for how a company achieved that profit, whether through genuine operational growth, cost cutting, or accounting choices that boost reported earnings in the short term without reflecting real business momentum.
These Three Ratios at a Glance
| Ratio | Formula | What It Tells You | What It Can Hide |
|---|---|---|---|
| EPS | Net Profit ÷ Outstanding Shares | Profit attributable to each share | Whether growth is genuine or accounting-driven |
| P/E Ratio | Share Price ÷ EPS | How expensive the stock is relative to earnings | Distortion from one-off earnings spikes or losses |
| ROE | Net Profit ÷ Shareholders’ Equity | How efficiently the company uses shareholder money | Can be inflated by high debt or share buybacks |
You May Also Like To Read About:
- You Found Your Grandparents’ Old Share Certificates. Here’s How to Actually Claim Them
- How to Read a Stock’s Balance Sheet Without an MBA
- Demat Account Charges Explained: AMC, Brokerage, and DP Charges Compared (2026)
- What Is an IPO? How a Company Goes Public, and How Allotment and Pricing Actually Work
- Best Stocks Under ₹50 in India: How to Actually Evaluate Them (Not Just a Tip List) — 2026 Guide
- Stock Market Technical Analysis Basics for Beginners: How to Read Trends, Not Just Prices
- Understanding Sensex and Nifty: What Stock Market Indices Actually Mean
About This Guide
This article uses the Nifty 50’s P/E ratio as of mid-August 2026, approximately 20.6, compared to its 10-year historical average of around 23.4, based on NSE index data. Individual stock P/E, ROE, and EPS figures should always be checked against current, company-specific data from official sources like the company’s quarterly results, annual report, or a reliable financial data platform, since these figures change with each reporting cycle.
Common Mistakes People Make With These Ratios
Comparing P/E ratios across completely different sectors is probably the most common mistake, assuming a “low” P/E automatically means a stock is cheap or undervalued without checking whether that’s simply normal for its specific industry.
Chasing high ROE without checking debt levels is another frequent trap. A company with a 30 percent ROE built on heavy borrowing carries meaningfully more risk than one achieving a similar ROE with minimal debt, even though the headline number looks identical on the surface.
People also often look at a single quarter’s EPS in isolation, reacting to one strong or weak result without checking the multi-year trend, which tends to be a far more reliable signal of a company’s actual trajectory than any single reporting period.
Finally, treating any one of these three ratios as a complete investment decision on its own, rather than one input among several, including the balance sheet fundamentals, industry context, and broader market conditions, is a mistake that tends to catch even reasonably experienced investors off guard.
My Take
If I had to rank these three in order of how often they get misused, P/E would be first, precisely because it’s the most visible, most talked-about number, and the easiest to quote without actually understanding what’s driving it. EPS and ROE are the ratios that give P/E its actual meaning, a P/E of 20 means something very different attached to a company with rising EPS and strong ROE versus one with declining EPS and debt-inflated ROE. Learning to read all three together, rather than leaning on whichever one comes up in a conversation or a stock tip, is genuinely one of the more useful habits you can build as you move from just reading a balance sheet to actually evaluating whether a stock’s current price makes sense.
Frequently Asked Questions
1. What is a good P/E ratio for a stock? There’s no universal “good” number, since it depends heavily on the sector, growth expectations, and broader market conditions. It’s more useful to compare a stock’s P/E against its own historical range and against similar companies in its sector than against an arbitrary fixed threshold.
2. What does a high ROE actually mean? A high ROE generally indicates a company is efficiently generating profit from shareholder money, but it’s important to check whether that high ROE is driven by genuine operational efficiency or by high debt levels, which can artificially inflate the ratio.
3. How is EPS different from a company’s total profit? EPS divides a company’s total net profit by its number of outstanding shares, converting the company-wide profit figure into a per-share number that’s directly comparable to the stock’s price.
4. Why do two companies in the same sector have very different P/E ratios? This usually reflects different growth expectations, profitability trends, or perceived risk between the two companies, even within the same sector, so a P/E difference alone doesn’t automatically mean one stock is better or worse than the other.
5. Can a company have a high EPS but still be a bad investment? Yes, if that EPS came from a one-off event, like selling an asset, rather than sustainable core business operations, or if the stock’s price already reflects that earnings level and then some, making it expensive relative to future growth prospects.
6. What is considered a healthy ROE in India? This varies by sector, but a consistently strong ROE, generally in the mid-teens to twenties percent range without excessive debt, is often viewed favourably, though it should always be checked alongside the company’s debt-to-equity ratio for proper context.
7. Should I avoid stocks with a high P/E ratio? Not necessarily. A high P/E can reflect genuine, justified growth expectations for certain companies, particularly in fast-growing sectors. The key is checking whether the company’s earnings trajectory actually supports that valuation, rather than avoiding high P/E stocks by default.
8. How often does a company’s EPS, P/E, and ROE change? EPS and ROE typically update with each quarterly result, while P/E changes continuously since it depends on the stock’s current market price, which moves daily even though the earnings figure it’s divided against only updates quarterly.
9. What is the current Nifty 50 P/E ratio? As of mid-August 2026, the Nifty 50’s P/E ratio was around 20.6, below its 10-year historical average of approximately 23.4, suggesting the broader market was trading in a fairly valued range rather than clearly expensive or cheap territory.
10. Do I need to check the balance sheet in addition to these three ratios? Yes. These three ratios focus on valuation and profitability efficiency, but they don’t capture a company’s debt levels, liquidity, or overall financial health, which is exactly what balance sheet analysis is meant to reveal, making the two approaches complementary rather than substitutes for each other.
Disclaimer
This article is for informational and educational purposes only and does not constitute investment advice. P/E ratio, ROE, and EPS figures change with each company’s reporting cycle and current market price, and the Nifty 50 figures cited here reflect a specific point in time as of mid-2026. Please verify current, company-specific figures from official sources before making investment decisions, and consult a qualified financial advisor for guidance tailored to your situation.

Shuchi founded Finance Checks after spending 16+ years working in corporate, managing operations and distribution. She managed her own finances, learned and read regularly and helped people make sense of their savings, loans, insurance, and investments.
She started this site to offer the kind of clear, honest financial guidance she wished was more available when she was learning to manage her own money. Every article is researched personally, checked against official sources such as the Reserve Bank of India, SEBI, or the Income Tax Department, and revisited whenever regulations or figures change. She is upfront about how the site earns money through ads and select affiliate partnerships, and she does not let either influence what she actually recommends to readers.